Chart patterns are like signposts in the world of trading, helping traders anticipate potential changes in price trends. Among the most reliable reversal patterns in technical analysis are the double top and double bottom chart patterns. in this article we will see What Is Double Top Chart Pattern & double bottom chart pattern and how to trade them. They’re easy to spot, and when used properly, they can signal when a trend might be ending helping you make smart entry and exit decisions in a trade.
What is a Double Top Chart Pattern?
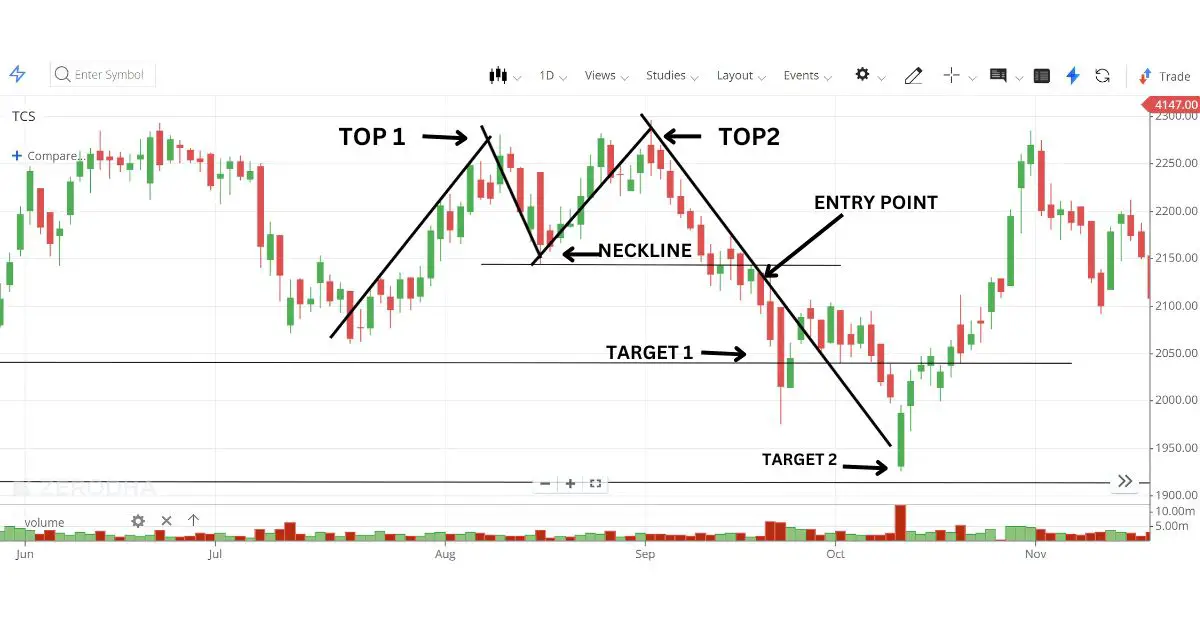
A double top is a bearish pattern, which means it signals a possible fall in price after a previous uptrend. It forms when the price reaches a peak level twice but fails to break through. Think of it like a cricket ball trying to clear the boundary—hitting the top of the fence twice but ultimately failing. This pattern shows that buyers are losing their strength, and sellers may be ready to take charge.
- Shape: Two price peaks that are nearly the same height, with a “valley” or trough in between, similar like M shape.
- Why It Matters: It indicates that the upward trend may be weakening, and a downturn could be on the horizon.
- Pattern Completion: A double top is confirmed once the price breaks below the low point (neckline) between the two peaks.
How To Trade Double Top Chart Pattern?
- Wait for the Neckline Break: A double top isn’t complete until the price breaks below the neckline, the support level between the two peaks. Jumping in too early could be risky, so wait for a clear breakdown below this level.
- Confirmation Entry: Once the price closes below the neckline on higher trading volume, it’s generally a strong signal that the trend reversal is underway. At this point, you can enter a short trade (a trade that profits from a falling price).
- Set a Stop Loss: Place a stop loss just above the second peak. This way, if the price moves up unexpectedly, your losses are limited.
- Profit Target: Measure the height from the neckline to the peaks. Use this distance to set a profit target below the neckline. For example, if the peak is ₹100 and the neckline is ₹95, the height is ₹5. Subtract ₹5 from ₹95, setting a profit target at ₹90.
How to Exit a Trade with a Double Top Pattern
- Take Profit: Exit your trade once the price hits the target. Avoid holding out for a larger drop, as double tops often complete their move within this range.
- Adjust Stop Loss: As the price moves in your favour, consider trailing your stop loss to lock in profits.
What is Double Bottom Chart Pattern?
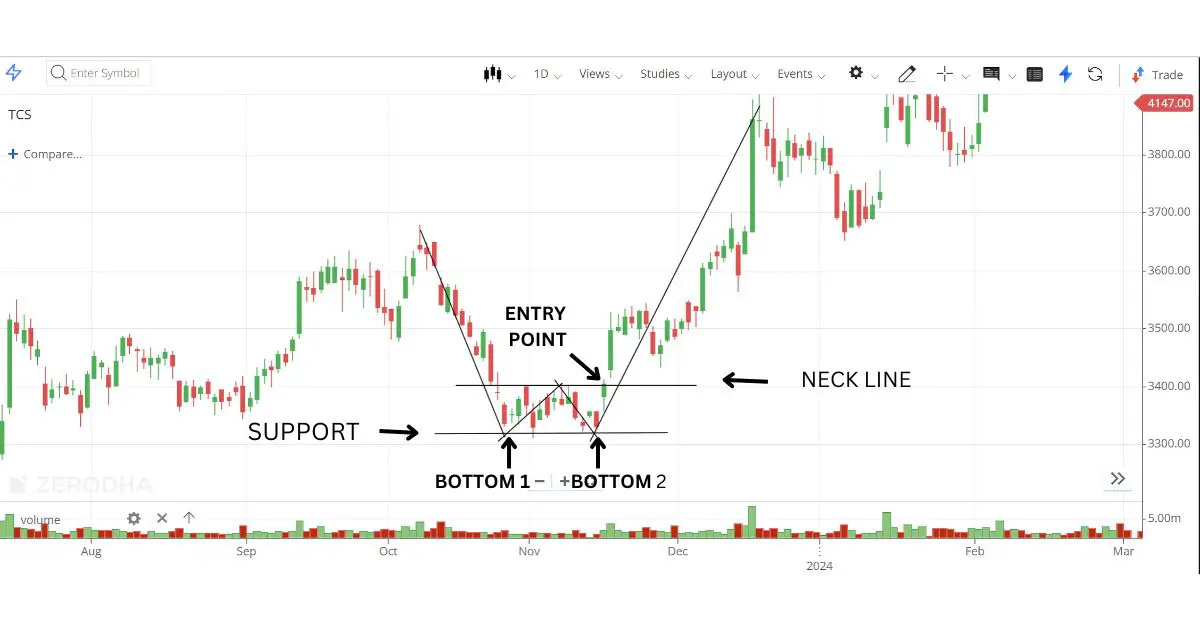
The double bottom is the opposite of the double top—a bullish reversal pattern that appears after a downtrend. It signals that the price might be done falling and could be ready for an upward shift. Picture a ball bouncing off the floor, making two bounces before finally gaining height. This pattern shows that sellers are losing their grip, and buyers may be taking over.
- Shape: Two low points (troughs) at roughly the same price, separated by a peak, its shape like W letter.
- Why It Matters: A double bottom tells traders that the downtrend may be ending, and an uptrend could follow.
- Pattern Completion: A double bottom is confirmed when the price breaks above the resistance level (neckline) formed by the peak between the two lows.
How To Trade Double Bottom Chart Pattern?
- Wait for the Neckline Break: Just like the double top, the double bottom requires patience. Wait for the price to break above the neckline, which is the resistance level between the two lows.
- Confirmation Entry: Once the price closes above the neckline on strong volume, it signals the start of a potential uptrend. Enter a long trade (a trade that profits from rising prices).
- Set a Stop Loss: Place a stop loss just below the second low to protect yourself in case the price doesn’t continue upward.
- Profit Target: Measure the height from the neckline to the lows. Project this distance upwards from the neckline to set a profit target. For example, if the low is ₹50 and the neckline is ₹55, the height is ₹5. Add ₹5 to ₹55, setting a target at ₹60.
How to Exit a Trade with a Double Bottom Pattern
- Take Profit: Exit your trade when the price reaches your target, as the double bottom often signals a reversal but not always a long-term uptrend.
- Trailing Stop: As the price increases, adjust your stop loss to follow the price, securing profits while allowing for additional gains.
Tips for Trading Double Top and Double Bottom Chart Patterns
- Use Volume for Confirmation: Breakouts with higher trading volume increase the reliability of the pattern. If the price breaks the neckline with low volume, it might be a false breakout.
- Trade on Reliable Timeframes: These patterns work best on daily or weekly charts. They are less reliable on very short timeframes like 1-minute or 5-minute charts.
- Set Your Targets and Stop Losses: Using fixed targets and well-placed stop losses makes your trades less emotionally driven and helps maintain discipline.
- Be Patient: Double tops and bottoms can take time to form and fully develop. Rushing into trades can lead to premature entries and increased risks.
- Don’t Over-Rely on Patterns Alone: While double tops and bottoms are powerful, consider other indicators like moving averages or trendlines to get a fuller picture before entering trades.
Real-Life Examples
- Double Top Example: Imagine a stock that’s been rising for a while, peaking at ₹100. It drops to ₹95, rises again to ₹100 but fails to break above. When it falls and breaks below ₹95, it confirms a double top, signalling a likely reversal to the downside.
- Double Bottom Example: A stock in a downtrend falls to ₹50, rises to ₹55, and then dips back to ₹50 again. When it finally breaks above ₹55, it confirms a double bottom pattern, indicating potential upward momentum.
Conclusion
Mastering double top and double bottom patterns can be incredibly beneficial for traders looking to spot market reversals. By waiting for confirmation, setting proper entry and exit points, and managing your risk with stop losses, you can make these patterns a valuable part of your trading strategy. Remember, discipline and patience are just as essential as pattern recognition—successful trading comes down to preparation and consistent execution.
“Disclaimer: This information is for educational purposes only and should not be considered financial or investment advice. Please consult a professional before making any financial decisions. Trading and investing involve risks; past performance is not indicative of future results.”
TOP FAQ
1. What exactly are double top and double bottom patterns in technical analysis?
- Answer: Double top and double bottom patterns are chart formations that can signal a possible trend reversal. A double top indicates that prices may start falling (bearish reversal), while a double bottom hints that prices could start rising (bullish reversal).
2. How reliable are double top and double bottom patterns?
- Answer: These patterns are usually quite reliable, especially when seen on longer timeframes like daily or weekly charts. But they are not 100% certain, so it’s wise to confirm them with other indicators before trading.
3. What’s the best way to confirm a double top or double bottom pattern?
- Answer: For confirmation, look for a breakout or breakdown of the neckline with increased trading volume. For a double top, the neckline acts as support, while for a double bottom, it’s a resistance level.
4. How should I set a stop loss when trading double top or double bottom patterns?
- Answer: For a double top, you can set a stop loss just above the second peak. For a double bottom, place it just below the second trough. This protects your capital if the pattern doesn’t go as expected.
5. How do I calculate the target profit in a double top or double bottom trade?
- Answer: Measure the height from the neckline to the peak (for a double top) or the trough (for a double bottom). Use this same distance to project a profit target from the point of breakout or breakdown.
6. Which timeframes work best for spotting double top and double bottom patterns?
- Answer: Daily or weekly timeframes tend to be the most reliable for these patterns. While you may spot them on shorter timeframes, they may not be as consistent due to intraday volatility.
7. Can double top and double bottom patterns form more than twice?
- Answer: Yes, sometimes you may see them form a “triple top” or “triple bottom.” These variations suggest even stronger levels of support or resistance, but they require careful analysis.
8. Are double top and double bottom patterns good for intraday trading?
- Answer: You can use them for intraday trading, but they are generally less reliable due to high price fluctuations in shorter timeframes. If using for intraday, confirm with other indicators for added safety.
9. Should I use additional indicators along with double top and double bottom patterns?
- Answer: Absolutely! Adding indicators like moving averages, RSI, or MACD can give you extra confirmation and help improve the accuracy of your entries and exits.
10. What common mistakes should I avoid when trading double top and double bottom patterns?
- Answer: Avoid jumping in too early without waiting for neckline confirmation, ignoring trading volume, and neglecting to set a stop loss. Being patient and disciplined really pays off in this style of trading.