Swing trading offers a way to profit from market moves without constant monitoring, but finding the right setups is key. High Probability Swing Trading Strategies focus on tried-and-true patterns and indicators that give you a better chance at success. In this guide, we’ll dive into simple, effective strategies to help you make smarter, more profitable trades. Whether you’re new or experienced, these insights can make a real difference in your trading results.
What Is Swing Trading?
Swing trading is a strategy designed for those who want to capture price “swings” or fluctuations within an asset’s ongoing trend. Instead of making rapid trades like day traders who close all positions by the end of the day, swing traders hold onto their trades a bit longer, usually anywhere from a few days to a few weeks. This approach aims to profit from significant price movements over a shorter period, targeting assets like stocks, currencies, or commodities.
One of the appealing aspects of swing trading is that it doesn’t demand the constant monitoring required in day trading, nor does it involve the long-term commitment of investing. Many swing traders rely on technical analysis to spot potential trading opportunities, although some also consider fundamental factors to strengthen their approach.
How Swing Trading Works?
Swing trading works on the idea that prices rarely move in one smooth direction; they tend to swing up and down. This creates opportunities for traders to buy at lower points and sell at higher ones within the general trend. Here’s a quick rundown of how swing trading plays out:
- Identify a Trend: The first step is to recognize the current trend, whether it’s moving upward (bullish) or downward (bearish). Traders rely on technical analysis to spot these trends.
- Find Entry and Exit Points: To pinpoint the best times to buy or sell, swing traders use tools like moving averages, the Relative Strength Index (RSI), and the Moving Average Convergence Divergence (MACD) indicator. These indicators help them identify the ideal moments to enter or exit a trade.
- Hold the Position: Unlike day traders who may react to every minor movement, swing traders are prepared to hold their position through short-term ups and downs, betting on a larger price swing.
- Exit at Target Price or Stop Loss: Finally, the trade is closed once the target price is reached, capturing the desired profit. Alternatively, if the trade goes in the wrong direction, the position is exited at a pre-set stop loss to limit any potential losses.
This balanced approach allows swing traders to participate in the market actively but without the intense focus required for day trading, making it a flexible option for those who want to pursue trading as a part-time activity or alongside other commitments.
High Probability Swing Trading Strategies

50-Day Moving Average Swing Trading Strategy
- Setup: To start, this strategy uses the 50-Day Moving Average (MA) as a guiding light to spot overall trends. Traders typically look at daily charts and search for bullish candlestick patterns—like hammers or engulfing candles that indicate potential upward movement in a stock’s price.
- Entry Criteria: The first thing to do is confirm that the stock price is above the 50-day MA, which signals a bullish trend. Once that’s established, wait for a bullish candle to form. This candle acts like a signal flare; when it appears, you can plan to enter the trade at the high of this candle, signaling that a breakout may be on the horizon.
- Stop-Loss Placement: To protect yourself from potential losses, it’s wise to set a stop-loss just below the low of the bullish candle. This safety net helps shield your investment if the price doesn’t maintain its upward path.
- Take Profit Strategy: When it comes to taking profits, aim for a risk-reward ratio of at least 1:2. For example, if your stop-loss is set 2% below your entry point, you should target a profit that’s at least 4% above it. Also, consider using a trailing stop as the price moves in your favor, which allows you to lock in profits while still giving the stock room to run.
- Trade Management: Keeping an eye on your trades is crucial. If the stock price keeps climbing, it might be a good idea to adjust your stop-loss to protect your gains. And when the price reaches your profit target, stick to your plan and exit the trade as you’ve laid out.

200-Day Moving Average Swing Trading Strategy
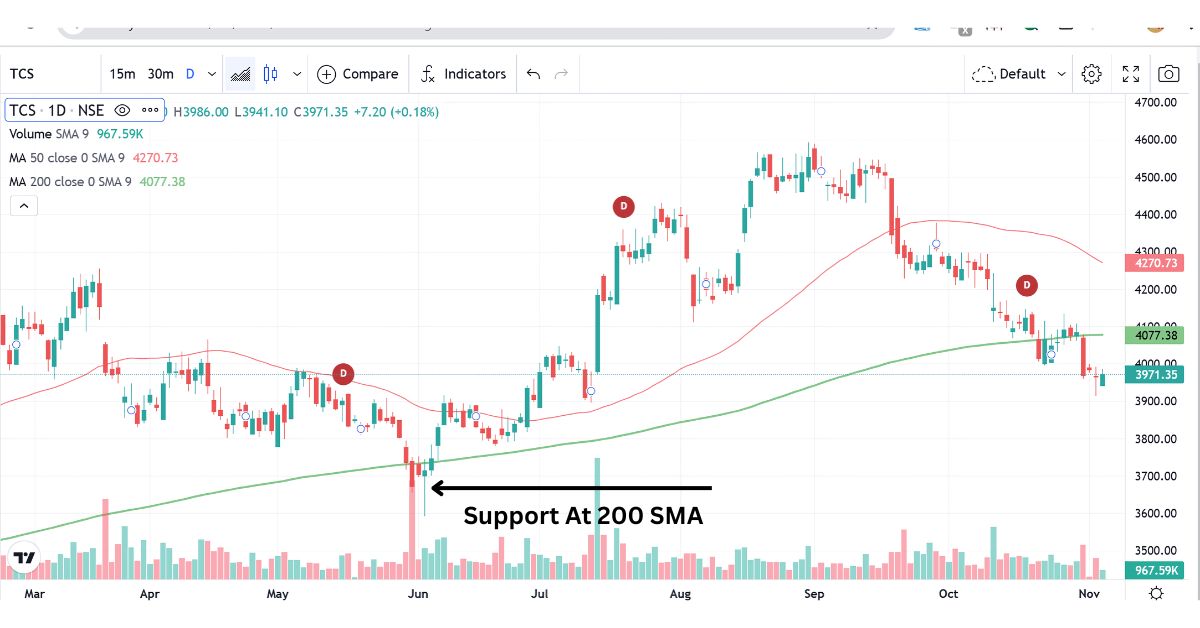
- Setup: Start by using the 200-Day Moving Average (MA) to identify a bullish trend. Focus on daily charts and look for bullish candlestick patterns, like hammers or engulfing candles, which signal upward potential.
- Entry Criteria: Make sure the stock price is above the 200-day MA, then wait for a bullish candle to form. Your entry point will be at the high of this candle, indicating a breakout.
- Stop-Loss Placement: Protect your investment by setting a stop-loss just below the low of the bullish candle, giving you a safety net if the price doesn’t continue upward.
- Take Profit Strategy: Aim for a risk-reward ratio of at least 1:2. If your stop-loss is 2% below your entry, target a profit that’s 4% above. Consider using a trailing stop to secure profits as the stock rises.
- Trade Management: Keep an eye on your trades. If the price climbs, adjust your stop-loss to lock in gains. When you hit your profit target, exit the trade as planned.

Buy At Support Support Levels
Swing trading is all about capturing short- to medium-term price movements, and one of the most effective strategies is buying at support. Here’s a simple breakdown of how to implement this strategy successfully.
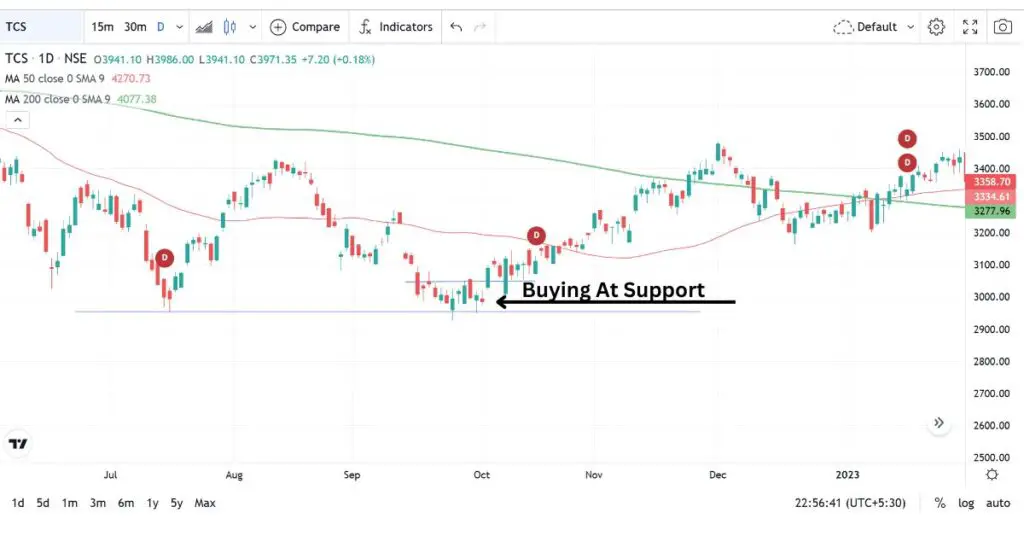
1. What is Support? – Support is a price level where a stock tends to stop falling and may even bounce back up. Think of it as a safety net for prices, created by buyers stepping in at that level. You can spot support by looking for:
- Previous Lows: Areas where the price reversed upward in the past.
- Trendlines: Drawn by connecting the lows on your price chart.
- Moving Averages: Key averages (like the 50-day or 200-day) can also act as support.
2. Identifying Consolidation – Consolidation happens when a stock trades within a tight price range, showing indecision in the market. Here’s how to analyze it. Mark the high and low of the consolidation zone. This creates a “box” where buying and selling pressures are balanced. Look for Bullish Candles, Patterns like a hammer or bullish engulfing candle near support can indicate potential reversals.
3. Waiting for Confirmation – Once you’ve identified support and consolidation, patience is key. Wait for the price to close above the upper range of consolidation or the high of a bullish candle. Look for Volume. An increase in volume during the breakout strengthens the signal that buyers are in control.
4. Entry Point– After Confirmation, Place your buy order after the price closes above the identified resistance or bullish candle.
5. Exit Strategy – Having a solid exit strategy is just as important as knowing when to enter. Set Profit Targets, Identify resistance levels or a specific profit goal based on your analysis. also Use a Trailing Stop-Loss, This helps you lock in profits as the price rises, adjusting your stop-loss order below recent lows.

Buy After Resistance Level Breakout
Swing trading is a fantastic way to capitalize on short- to medium-term price movements in stocks, and it’s a strategy many traders find rewarding. One of the most effective methods within swing trading is to focus on resistance level breakouts. Let’s break this down in simple terms.
What Are Resistance Levels?
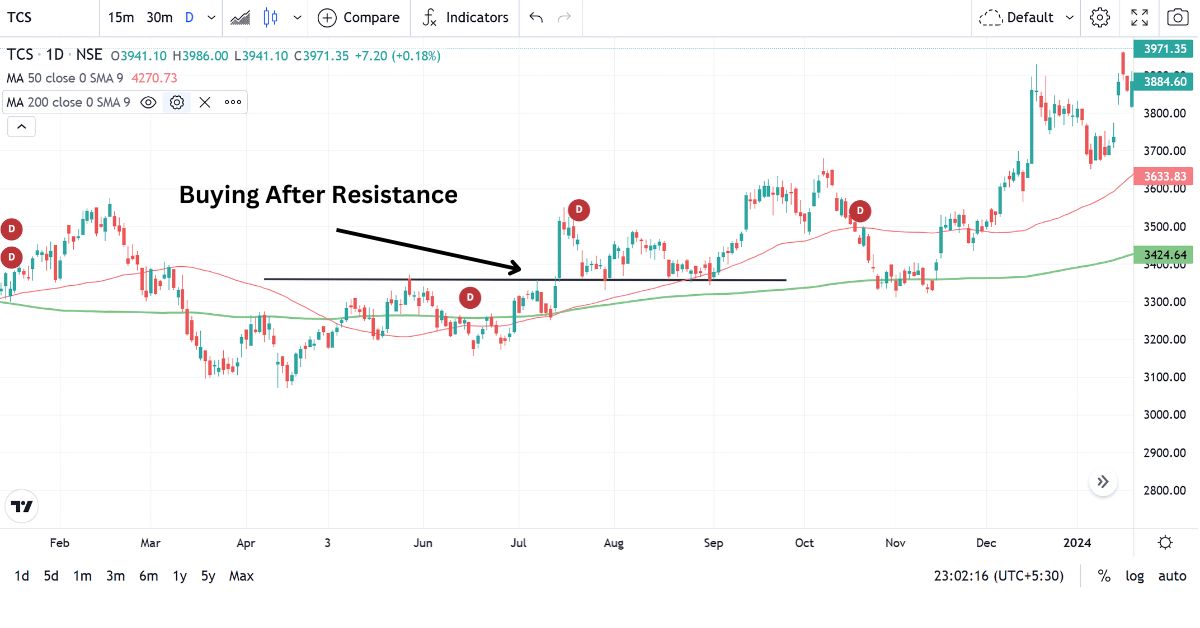
Imagine you’re watching a stock that just can’t seem to break past a certain price point—this is what we call a resistance level. Think of it as a ceiling that the stock struggles to rise above. When prices hit this level, sellers often come in, pushing the price back down. But when a stock finally breaks through that ceiling, it can signal a potential upward trend, and that’s where the opportunity lies!

1. Find Your Stocks – First, you’ll want to look for stocks that are bouncing back and forth between clear price levels these stocks are trading within a range. They’re typically moving between a support level and a resistance level. You can spot them by chart paterns and indicators.
- Chart Patterns: Use candlestick charts to spot patterns. Look for formations like rectangles where the price keeps hitting the same highs and lows.
- Indicators: Tools like moving averages or Bollinger Bands can help you gauge the overall trend and how much the stock price is moving.
2. Wait for the Breakout – Once you’ve found a stock that’s hitting that resistance level, it’s time to be patient. Wait for the stock to break above that level. A breakout can indicate that the stock is ready to move up. Look for a surge in trading volume when the stock breaks the resistance this shows that a lot of traders are interested in buying. but, Don’t jump in right away; false breakouts happen when the price dips back below the resistance level.
3. Look for a Retest – After the stock breaks above the resistance, it often pulls back to test that level again. This is where the magic happens—if the stock holds at this level and doesn’t fall back down, it reinforces the idea that it’s strong and ready to rise. Pay attention to how the stock behaves when it retests that resistance. If it bounces back up, that’s a good sign! also, you can look for consolidation or other reversal patterns that suggest buyers are stepping in.
4. Watch for a Bullish Candle Now, you want to see a bullish candle form after that retest. A bullish candle is a strong indication that buyers are taking control and pushing the price higher.
- Bullish Engulfing Pattern: This is when a larger green candle completely engulfs the previous red candle.
- Hammer Candle: This looks like a hammer with a small body and a long tail pointing down, showing that buyers have stepped in after a dip.
5. Enter In The Trade – Once you see that bullish candle, it’s time to get ready to enter the trade. The best time to jump in is when the price breaks above the high of that bullish candle. That’s your signal that the trend is likely to continue.
6.Targets and Stop Losses – Before you dive in, you need to set your targets and stop losses to protect your investment. Aim for a risk-reward ratio of at least 2:1. For instance, if you risk $1, aim to make $2. Look at previous resistance levels or use tools like Fibonacci retracement for potential target points. Place your stop loss below the retest level or the low of the bullish candle. This way, if things go sideways, you limit your losses.
FAQs On Swing Trading
- What is swing trading?
- Swing trading is all about catching short- to medium-term price movements. Instead of making quick trades all in one day, swing traders hold onto their positions for several days or even weeks.
- How does swing trading differ from day trading?
- Unlike day trading, where you’re buying and selling stocks within the same day, swing trading lets you keep your positions open longer, allowing for bigger price changes to play out.
- What’s the best time frame for swing trading?
- Swing traders usually look at daily or weekly charts to get a feel for how prices are moving over a longer period.
- What tools do swing traders use?
- Traders often rely on indicators like moving averages, the Relative Strength Index (RSI), and MACD to help them spot trading opportunities.
- What’s a stop-loss?
- A stop-loss is a safety net you set up to automatically sell a stock if it drops to a certain price, helping you minimize losses if things don’t go your way.
- What does risk-reward ratio mean?
- The risk-reward ratio is simply a way to compare how much you’re willing to lose versus how much you hope to gain from a trade. A common goal is to aim for a 1:2 ratio, where you risk $1 to potentially make $2.
- What are support and resistance?
- Think of support as a safety net where a stock price tends to stop falling, and resistance as a ceiling where the price struggles to go higher. These levels are crucial for swing traders.
- How can I spot a swing trade?
- Look for stocks that are bouncing up and down within a trend. You can use various technical indicators to help you decide when to jump in or out.
- Is swing trading good for beginners?
- Absolutely! Swing trading can be a great way for beginners to get into trading without the intense pressure of day trading.
- Can swing trading be automated?
- Yes! Many traders use automated systems or trading bots to handle their swing trading strategies, making it easier to stick to their plans.