Stock profit calculator:stock average calculator:
Live Market Data
| Stock Price | Shares | Total Cost |
|---|
Average Price: 0
Potential Profit/Loss:
Profit at R1: 0
Profit at R2: 0
Profit at 52-Week High: 0
Loss at S1: 0
Loss at S2: 0
Loss at 52-Week Low: 0
Stock Average Calculator
The Stock Average Calculator calculates the average purchase price of stocks when bought at different prices and quantities. This tool is useful for averaging out investment costs and making informed trading decisions.
- Calculate the average price of your stock purchases.
- Estimate potential profit/loss at different market levels.
- Make informed investment decisions based on projections.
Stock Profit Projections Calculator
The Stock Profit Calculator helps investors estimate potential profits or losses based on entry price, target levels, and total shares. It provides quick insights into expected returns at different price points.
- Live Market Price – The current price of the stock.
- Resistance Levels (R1, R2) – Points where the stock might face selling pressure.
- Support Levels (S1, S2) – Levels where the stock may find buying interest.
- 52-Week High/Low – Highest and lowest price points over the past year.
Example Calculations
Example 1: Stock Averaging Calculation
Scenario: You buy a stock in multiple transactions.
| Purchase Price | Shares Bought | Total Cost |
|---|---|---|
| ₹100 | 10 | ₹1,000 |
| ₹120 | 20 | ₹2,400 |
| ₹110 | 15 | ₹1,650 |
Average Calculations
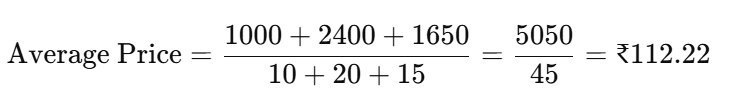
Your average stock purchase price is ₹112.22 per share.
Example 2: Profit/Loss Projection Calculation
Stock Details:
- Average Price: ₹112.22
- Total Shares: 45
- R1: ₹130 | R2: ₹140
- S1: ₹100 | S2: ₹90
To simplify the profit calculation:
- Profit at R1: Profit at R1=(130−112.22)×45=17.78×45=₹801.90
- Profit at R2: Profit at R2=(140−112.22)×45=27.78×45=₹1250.10
So, the profits at R1 and R2 are ₹801.90 and ₹1250.10, respectively.
To simplify the loss calculation:
- Loss at S1: Loss at S1=(100−112.22)×45=−12.22×45=−₹550
- Loss at S2: Loss at S2=(90−112.22)×45=−22.22×45=−₹998.10
So, the losses at S1 and S2 are ₹550 and ₹998.10, respectively.
3. Stock Market Tips & Insights
Why Use Stock Averaging?
- Reduces risk by averaging out price fluctuations.
- Helps in long-term investing strategies.
- Prevents emotional decision-making during market volatility.
When to Sell for Maximum Profit?
- At Resistance Levels (R1, R2): When the stock approaches a strong resistance zone, selling may be beneficial.
- Near 52-Week Highs: If fundamentals don’t support further growth, profit booking is advisable.
When to Hold or Exit?
- Near Support Levels (S1, S2): If the stock is fundamentally strong, holding at support zones can be a good strategy.
- Stop-Loss Strategy: If the stock falls below key support levels, consider exiting to prevent further losses.
FAQ
Q1: What is the benefit of stock averaging?
➡ Stock averaging helps lower the cost per share and reduces market volatility risks.
Q2: How do I use the calculator?
➡ Enter the price and quantity of stocks bought, then check profit/loss projections based on market levels.
Q3: How accurate are the projections?
➡ The projections depend on market movements and technical levels. Use them for analysis, not guaranteed results.
Q4: Can I use this for cryptocurrency or forex trading?
➡ Yes! This calculator works for any asset where averaging is applicable.
Latest Content from Stockpaisa
Check Denta Water IPO Allotment Status: Discover Simple Methods To Check Your Allotment.
IPO GMP Today, Latest IPO Grey Market Premium
Check Nifty 50 Stock List with Weightage, Lets Check For Bank Nifty,Sensex Also.
How to Increase Chances of IPO Allotment: Simple Tips and Strategies For RII, HNI Investors.